Everyone involved in a given market has been brought there by their peculiar set of circumstances and forces. Commercial traders come to the market out of fear. Fear that they may not be able to purchase forward operating inputs at favorable prices or, fear that they may not be able to get their anticipated production sold at favorable prices. Speculators, on the other hand, are driven by greed. More, more more. No high is high enough, and no low is low enough. In fact, the more distorted prices become, the larger the speculative position becomes in favor of that distortion. The battle between the commercial traders and the speculative traders is the focus of our research. We'll examine the last six months of soybean trading from both a discretionary, rules-based approach as well as a strictly mechanical treatment.
We'll begin with the discretionary version as this allows us to lay out the basics for our premise-based mechanical program. We track several parameters of the commercial and speculative trader groups in the Commodity FututresTrading Commission's weekly Commitments of Traders report. We've pared it down to the minimum, three-step process for the chart below.
First, we only trade in the direction of commercial momentum. If commercial momentum is positive, we look for buying opportunities. If commercial momentum is negative, we want to initiate short positions. We side with the commercial traders because they are range traders and we are swing traders. Our methodologies are similar. While our methods may be similar, our bankrolls are not. Therefore, we need to fine tune our entry points. We do this by waiting for a market to meet the following two criteria. First, the market must be overextended. Second, we wait for the reversal before entering the market.
Positive commercial trader momentum(subgraph 3) + oversold short-term momentum(subgraph 2) = pending COT buy signal. The buy signal is triggered and the protective stop point is determined upon the reversal.
The buy signal is triggered, and the protective stop point is determined once our short-term momentum indicator signals the underlying market's reversal.
Short trades apply the same logic in reverse.
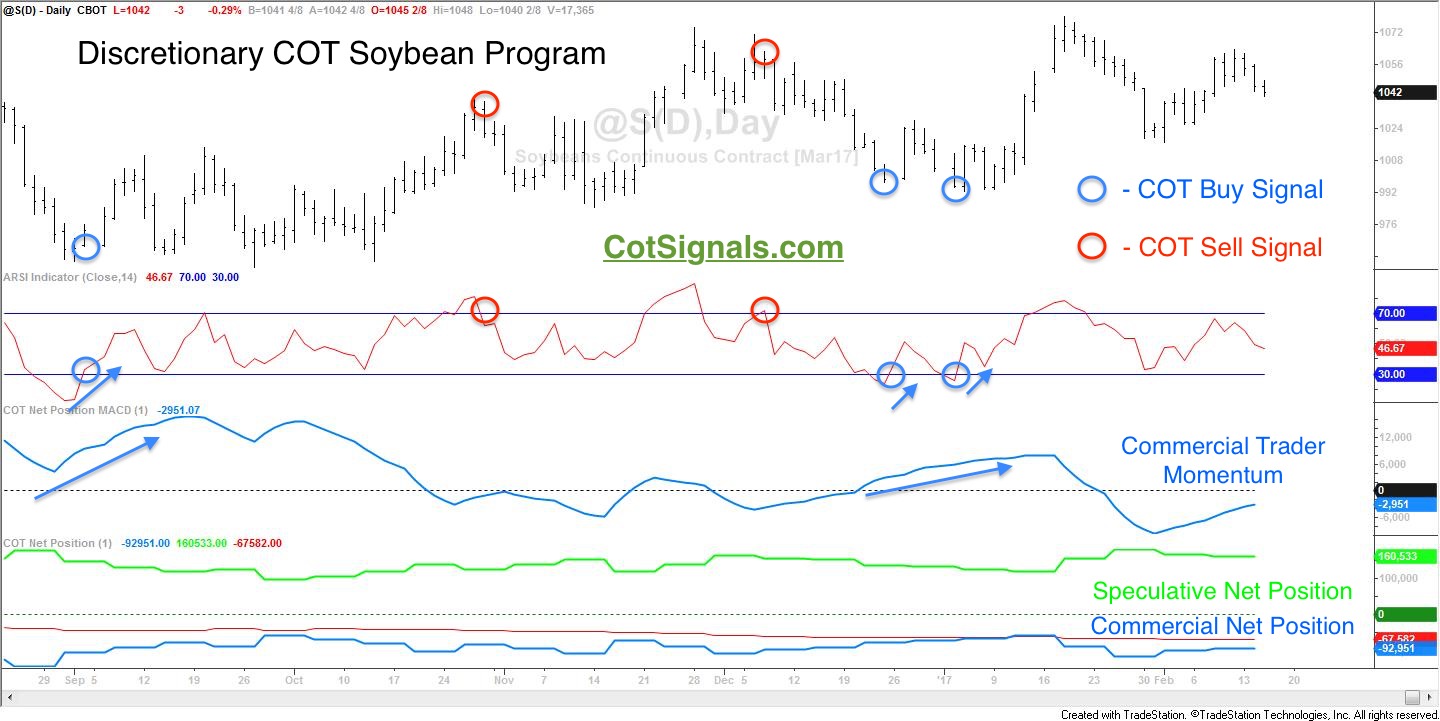
One last note about the Discretionary COT Signals, the protective stop points are always highest, high or the lowest, low generated by the market's reversal. As you can see, the relatively benign nature of the soybean market has led to few trading opportunities using our traditional methodology. We currently see commercial processors buying soybeans between $10-$10.50. We think this could very well lead to the spring rally. Most importantly, we believe planting high could very well be the high print for the year. We'll be watching the farmers' reaction to higher prices keenly.
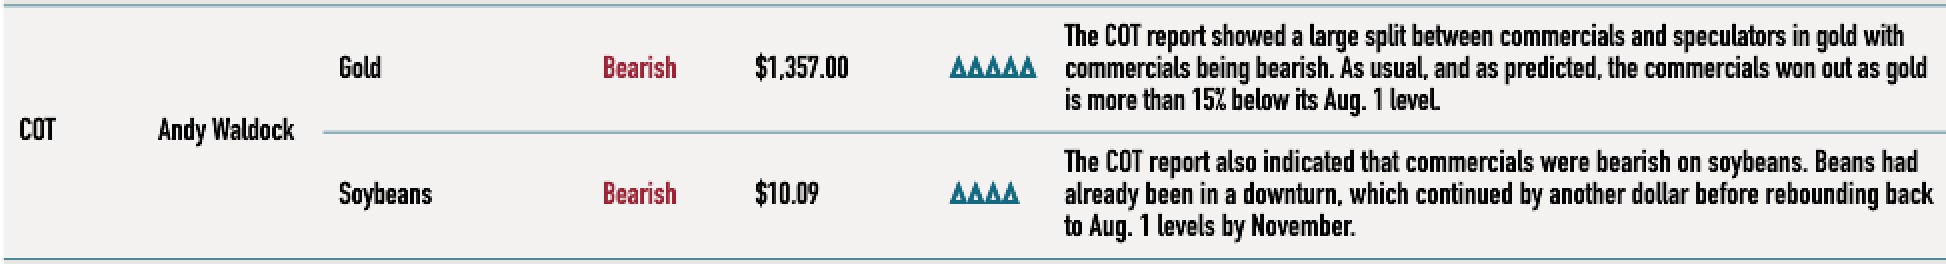
This is the type of long-term analysis we use in our monthly Commitments of Traders column for Modern Trader magazine. See their kind words on our soybean forecast in the March '17 issue, below.
Editor's comments and discretionary signals that place dots at highs and lows look great but, taking it a step further has led to the mechanical swing-trading program you'll see below. The reason for my relentless pursuit towards the mechanization of this process dates back to the late 90's and my transition from floor trader in the S&P 500 pit at the Chicago Mercantile Exchange to screen trader. I'd finally been shown a way to mechanically test all the stuff I'd learned in my years as a young floor trader. I quickly found out that most of the things I was taught as "rules" simply aren't profitable when applied mechanically.
I also learned that the biggest variable in my trading was myself. Therefore, I've had to take myself out of the equation to consistently apply my research and trust that my research is in the program. Below, you'll see the mechanical version of our soybean program.
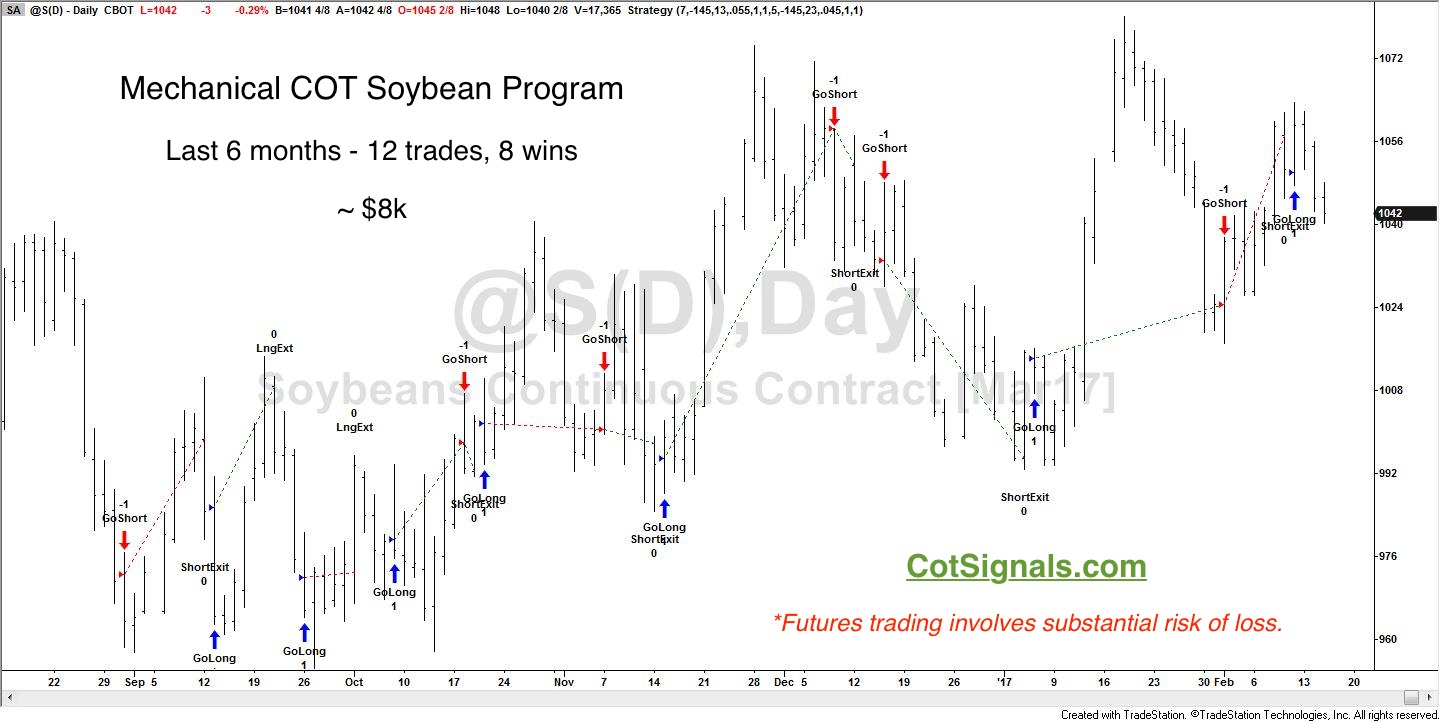
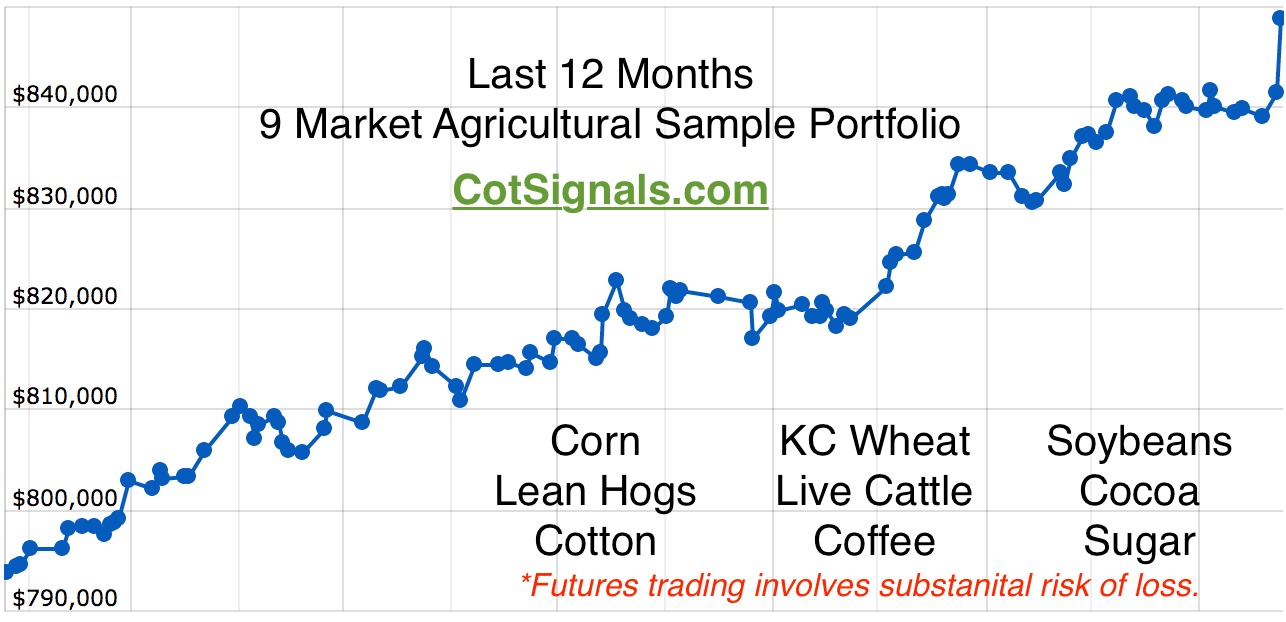
We've developed this program over all the primary domestic futures markets. Its applicability across markets is one of its key strengths. The soybean market above is part of the nine markets agricultural portfolio. Notice specifically, that the mechanical version adheres to the same logic as the discretionary model. The program is buying on market declines as commercial momentum builds and is selling on rallies as commercial momentum falls.
When you look at the nine market sample portfolio below, please follow the link to the Equity Curves page. There, you will be able to build sample portfolios using the markets of your choice. The combined equity curves of the markets you choose will provide a visual glimpse of the risk your selected portfolio would've exhibited in the past. But remember, every investment's biggest drawdown lies in the future.
We base our trades on the actions of the people pulling the commodity out of the ground and processing it for resale. We believe this provides a solid top down and bottom up approach to commodity markets. Furthermore, we expect the current build to into spring to set up a fantastic short sale opportunity. Whether we are trading for ourselves or discussing hedge strategies, knowing when to pull the trigger is crucial. Our methodology is uniquely positioned to translate and capitalize on weekly fundamental data on a daily timeframe.