The interest rate rally over the last month has been fairly anemic considering the record long position the commercial traders carried into this year. We'll look at the 10-year Treasury Note futures on a daily and weekly scale along with Commitment of Traders (COT) report.
We track the commercial and speculative categories of the COT report. Our research has shown substantial differences between the two trading groups usually resolve themselves in favor of the commercial trader group's forecast. Therefore, when the commercial traders set net and total position records earlier this year our commentary was unabashedly bullish.The daily chart you'll see below includes a couple of early losers as a result of their bullishness. Fortunately, the last two COT buy signals were more successful.
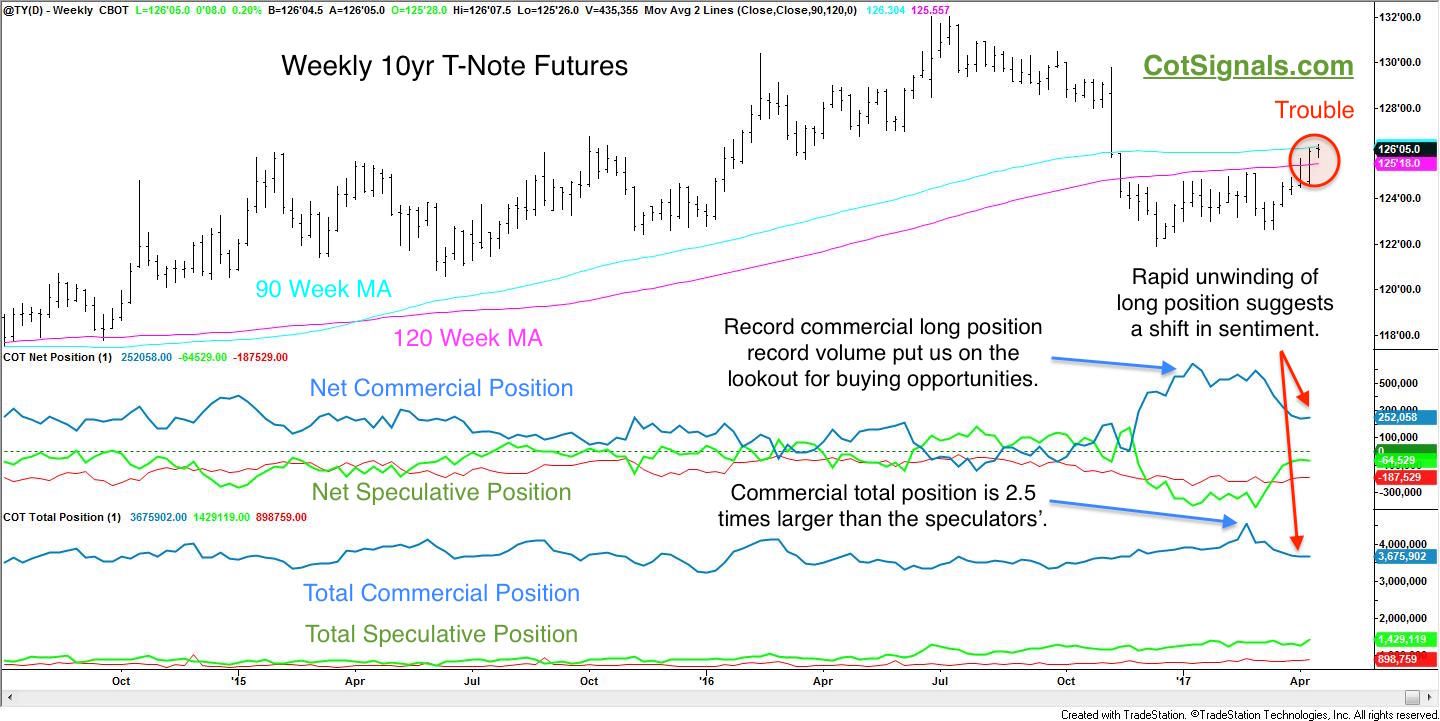
We use the weekly COT report as an initial screen to get us on the same side as the commercial traders' momentum. If we're going to place our dollars at risk, we want the commercial traders' collective leverage and resources behind us. The weekly chart provides context for the record positions as well as long-term moving averages that show what was once support is now, resistance. It also clearly shows that while the commercial and speculative net positions may mirror each other, the commercial traders truly dominate the market as their total position is more than twice the speculative total position, on average. Lastly, the weekly chart provides visual confirmation that the commercial traders are using this rally to unwind their recent record position very quickly.
Meanwhile, the daily chart shows the premature buy signals as well as the last two, which worked fairly well. The daily chart is our standard commitments of traders worksheet setup. Here's how the buy signals take shape. First, commercial trader momentum must be positive. Obviously, their record position setting position took care of this. Second, we wait for the market to become oversold on a short-term basis. Interest rates soared post-election pushing prices through the floor. Third, once the market reverses, we enter a long position and place a protective sell stop at the recent low. Note the red lines on the left side of the chart for the stop loss placement points that were triggered get us out of the market. We believe in resting stop loss orders. Anything can and will happen. This allows us to quantify our risk pre-trade while sleeping peacefully during the overnight markets.
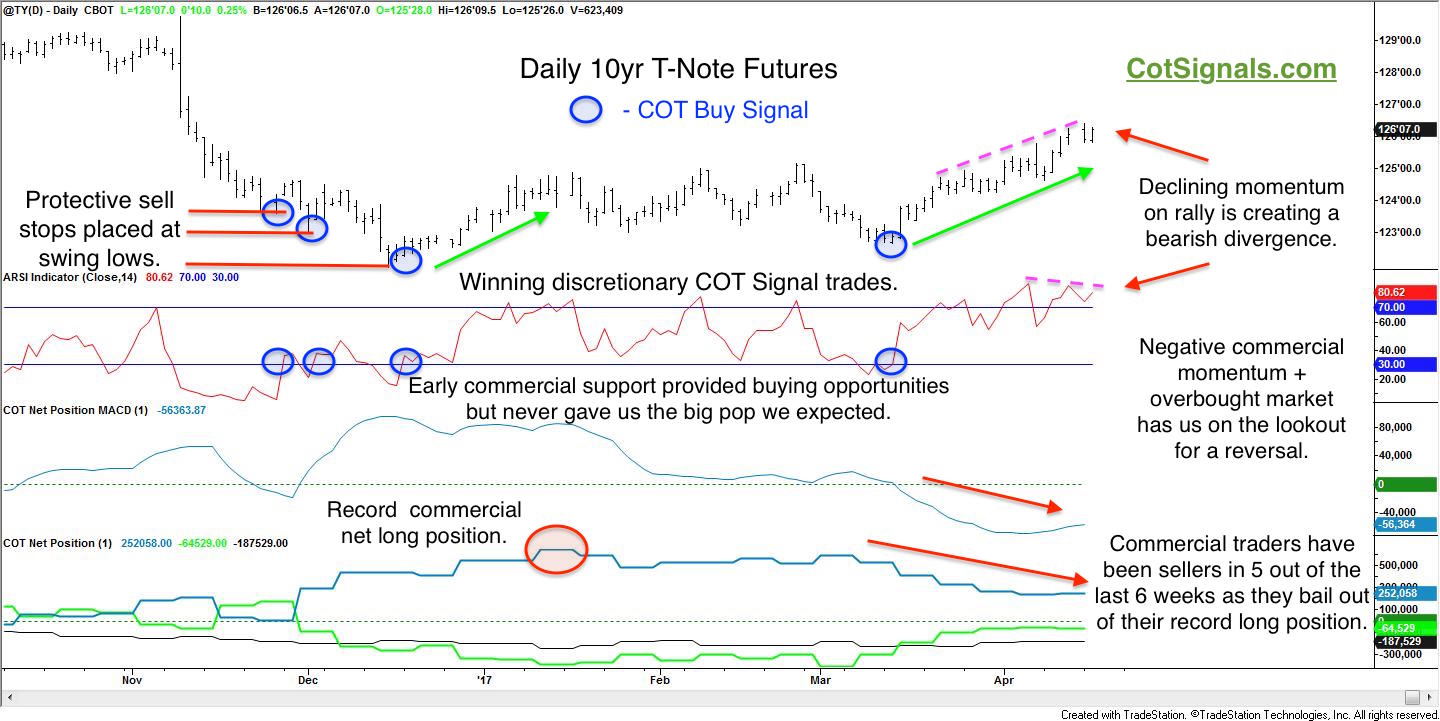
Taking a step back and putting it all together, the 10-year Treasury Note futures are facing stiff overhead technical resistance in the face of rising rates. Furthermore, the daily chart is beginning to show that the market is using more energy to make smaller gains. We think commercial selling is capping these gains as they shift from a record bullish position just a couple of months ago to what will be a hawkish outlook. Their selling on this rally also provides further indication of the consensus that the low rate for this cycle has already printed.