Live cattle prices have risen more than 14% since the September low, and more than 40% since their October 2016 low. This rally has been sufficient to generate a bit of speculative euphoria. Speculators actually set a net long record this past June, at the year's high and are within a whisker of establishing a new bullish net long record position right now. Of course, the flip side of this is that we're seeing ranchers sell their cattle forward, as they don't expect to receive the same price at delivery that they currently can get in the futures market. We expect this to play out as weakness in the cattle futures through November and into December.
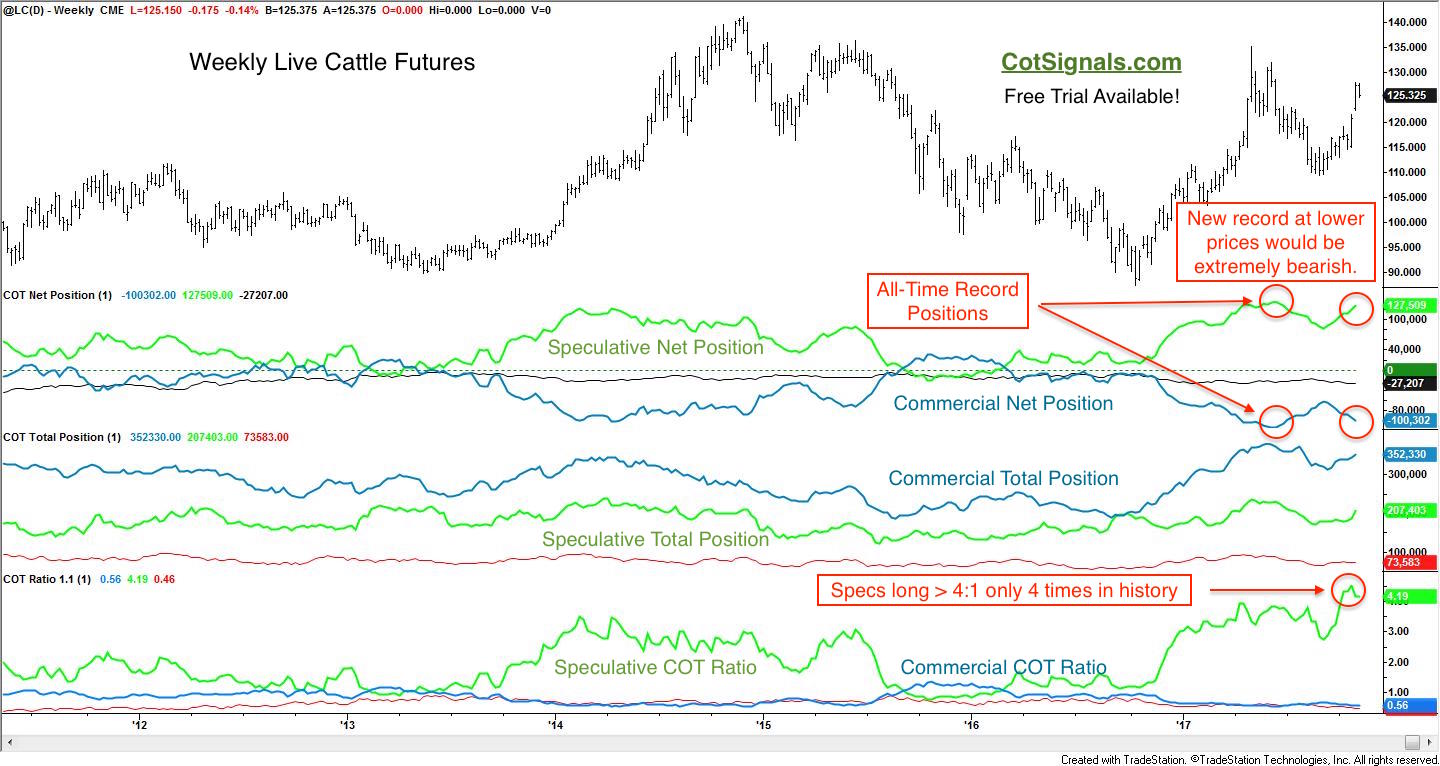
We'll begin by examining the weekly live cattle chart along with the Commitment of Traders report data in the subgraphs as well as our COT Ratio. We use the weekly Commitment of Traders report to tally the open positions among the commercial and speculative traders. Our thesis is that conflict between these two groups typically resolves itself in favor of the commercial traders. They have access to better information and dispassionately execute their hedging strategies. This is the complete opposite of the speculative traders who come and go from market to market hoping to catch a trend. In fact, our entire strategy could be considered a fundamentally based countertrend reversal methodology.
The first subgraph plots the net position of the trader groups. We've highlighted the recent record positions. The critical relationship in this plot is that the commercial traders are very near to setting a new net short record position, eclipsing the June record set at higher prices. This means that commercial traders are adding short positions at lower prices. This runs counter their typical scale in strategy and is exceptionally bearish.
The second subgraph plots the total positions held by the various trader groups. Note that the commercial traders' total position is more than 50% larger than the speculators'. This shows that the commercial traders have solid control over the current market. Occasionally, a market will run so hard, and so fast that the speculative traders can actually overtake the commercial traders' positions because once the commercial traders have hedged their forward risk, they're done. Therefore, every market has a commercial trading capacity limit. Commercial traders are near their record total position of just over 380k. We'll keep an eye on this.
Finally, the third subgraph represents our COT Ratio. This works out to the number of contracts long vs. short within the different trading groups. The speculators are currently long more than four contracts for every contract they're short. There have only been three other occurrences when the speculators were this wildly bullish. It is important to remember that this indicator has no ceiling. New speculators can always come into a market but, new commercial capacity comes online at a snail's pace.
![COT Free Trial[1] copy](https://waldocktrading.com/wp-content/uploads/2016/09/COT-Free-Trial1-copy.jpg) Now, let's move to the daily chart and the trade setup. We look for markets where the commercial and speculative traders are waging battle. The bigger the battle, the better. Their conflict is graphically depicted via the combination of plotting commercial traders' momentum in conjunction with our variation of RSI. The setup is very straightforward. When the commercial traders are short, and a market becomes overbought, we begin looking for a reversal in line with the commercial traders' momentum. This is the case in the current live cattle setup. Commercial traders are exceptionally bearish while speculative bullishness is record-setting. Once the market reverses, we issue the appropriate trading signal and place a protective stop order at whatever the swing high or, low turns out to be. We've illustrated the Discretionary COT Signals and the protective stop levels on the daily live cattle futures chart, below.
Now, let's move to the daily chart and the trade setup. We look for markets where the commercial and speculative traders are waging battle. The bigger the battle, the better. Their conflict is graphically depicted via the combination of plotting commercial traders' momentum in conjunction with our variation of RSI. The setup is very straightforward. When the commercial traders are short, and a market becomes overbought, we begin looking for a reversal in line with the commercial traders' momentum. This is the case in the current live cattle setup. Commercial traders are exceptionally bearish while speculative bullishness is record-setting. Once the market reverses, we issue the appropriate trading signal and place a protective stop order at whatever the swing high or, low turns out to be. We've illustrated the Discretionary COT Signals and the protective stop levels on the daily live cattle futures chart, below.
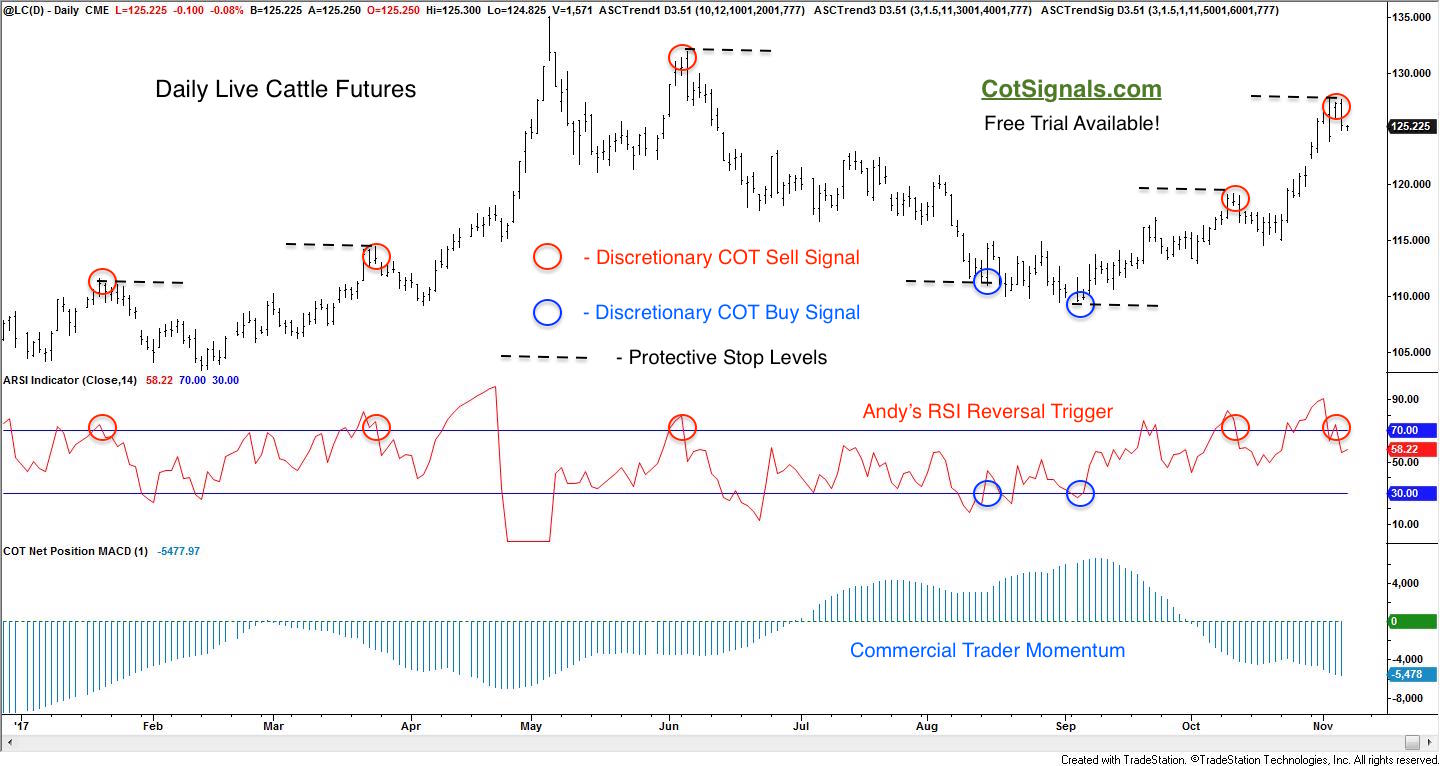
Therefore, the current setup calls for selling short the December live cattle futures and placing a protective buy stop at the recent swing high of 127.875. Finally, there is a strong seasonal component that should be addressed. The February live cattle contract tends to be extremely weak from a bit before Thanksgiving all the way through Christmas. Therefore, even though we've initiated this trade in the December live cattle futures (we are currently short), we'll add a February contract through our seasonal research in the not too distant future. In fact, the model we'll be employing has won more than 70% of its trades selling cattle during this period.