

The Australian Dollar has declined by nearly 4% since late January. Much of the sell-off has been profit taking and technical as the market has built up significant resistance around .81 to the US Dollar. We think the upward trend remains intact through the end of the month and a re-test of the resistance at .81. We've employed a nine-year model combining the Commitment of Traders report along with seasonality to capture the run we see expect in the coming weeks.
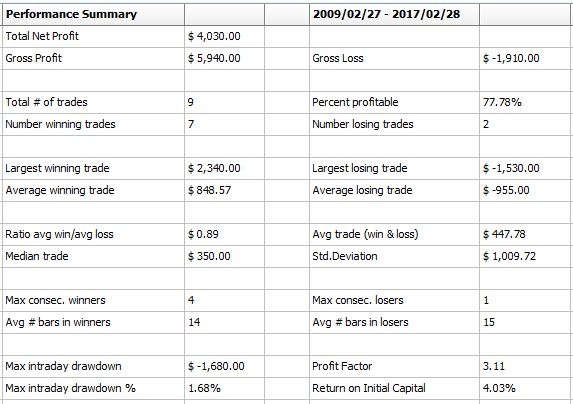
First, the standard performance metrics.
Next, the equity curve. The run we've chosen after 1,000 out of sample runs produced the following composite equity curve. These results have a higher winning percentage than the soybeans or the silver, thank goodness. The Dow trade we're currently in is our third set up for the month, and after losing in beans and silver, it'd be nice to finish strong in the Dow Jones and Australian Dollar with crude oil yet to come for the month of February.
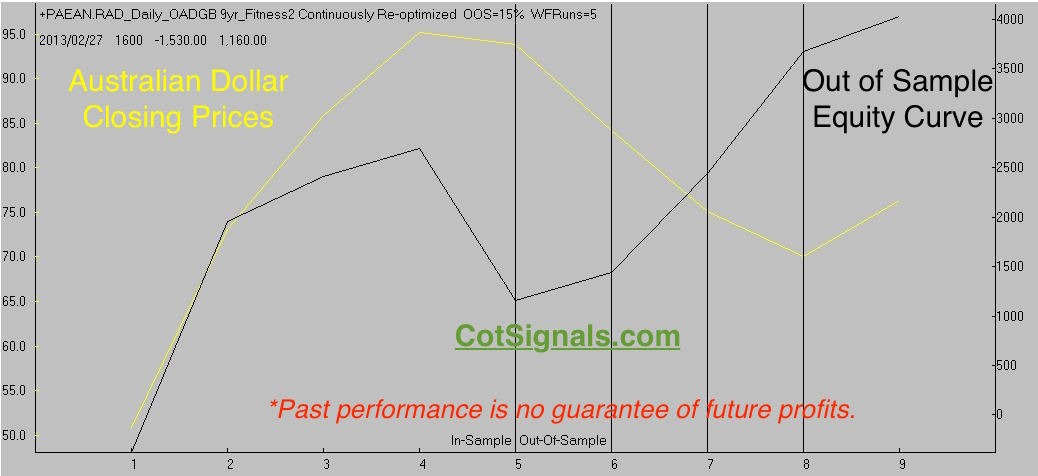
*Past performance is no guarantee of future profits.
Now, the Monte Carlo analysis. Note that the mean for these trades is $700, less than a one percent move at the current price of .7800. The average winning trade isn't much bigger at only $834. This brings us to the bigger question of risk management. We'll be placing a protective stop 1.5% below our entry price. Rarely will I risk more than I expect to make, however a winning percentage above 75% suggests this trade is worth the risk. Usually, I would recommend trading two or, even three contracts for this trade to normalize the return profile among all five trades offered this month. However, given the current volatility of the markets, in general, I'll only a take a two-thirds position with the idea of possibly adding on as the trade materializes.
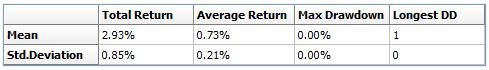
*Past performance is no guarantee of future profits.
Adding to positions should not be done in an unplanned knee-jerk manner. Below, I've posted the Monte Carlo distribution result plotting the average trade (w-l) by number days in the position. As you can see, the first five days are critical. There were a total of 1,280 possible outcomes in this testing run. The average result is positive for all investments held past five days. This means I'll be looking for a place to add to the position somewhere near the end of next week, depending on the chart formation. We'll be exiting this trade near the end of the month. Therefore, we may get a week's+ run carrying the extra leverage once the market has shown us it intends to move our way.

*Past performance is no guarantee of future profits.
Trade and money management are the second most critical tasks of trading. Many traders have imploded while trading profitable programs due to their humanity. Every chart we publish and every extrapolation we transfer from statistical report to market movement is an attempt to quantify, rather than qualify, a trading plan before placing money at risk. Trade distributions, means, and medians are all ways I'm trying to help you, the reader and, hopefully, subscriber, proactively manage both profits, and risk in a manner that is intuitive in concept even if the equations and dry discussions are a bit opaque.
Please feel free to ask any questions you may have through info@cotsignals.com or, sign up for our seasonal analysis for $35 per month and be notified of our actions on this trade as well as crude oil, next on our list, and more.


