

We'll be buying May soybeans either Friday or, Monday night for our second seasonal trade this month. This trade attempts to capture the upward bias of the market between the USDA's Prospective Planting report at the end of March through early spring planting fears. Allowing the market to quiet down after the $.50 spike following the Prospective Plantings report makes sense. Now, let's get to the details.
The Details:
May soybean futures margin - $1,705.
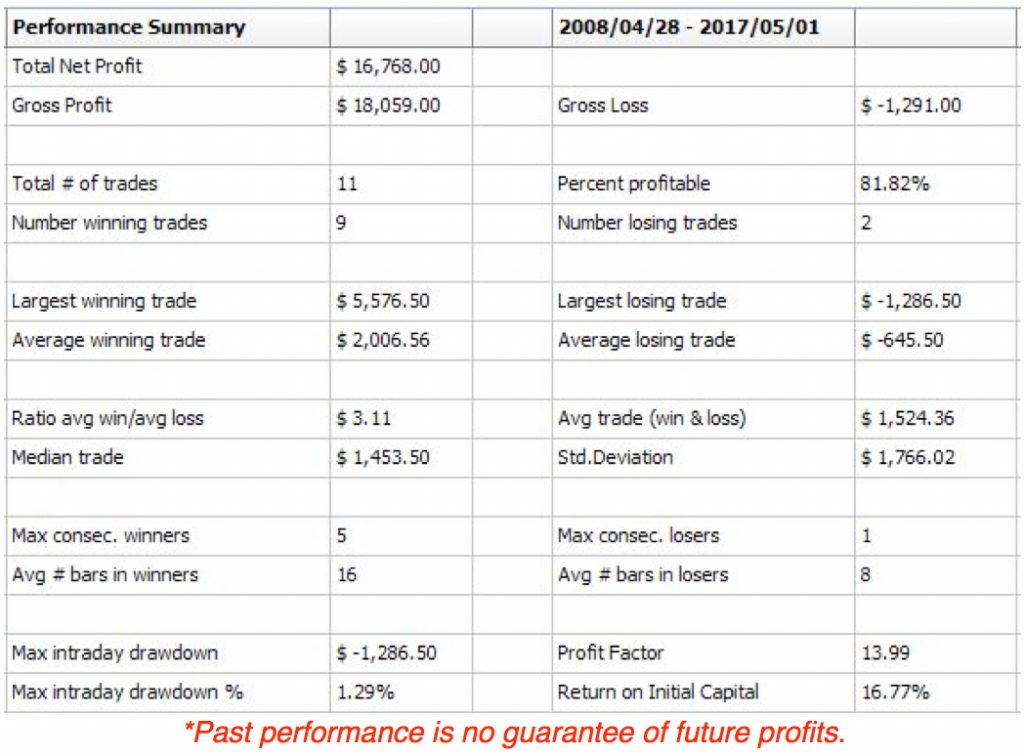
Risk - We'll be using a dynamic stop set to twice the average true range. The six-month average for this calculation is $.35 or, $1,750 per contract. The six-month range for this calculation has been $.16 - $1.00 or, $800 - $5,000. The May soybean average true range is currently $.01325 or, $662.5 per contract. Twice this value yields a current risk of $1,325 per contract.
Reward - The average return for this strategy is just under $1,800 for the three weeks we plan to hold the position. This is inclusive of wins/losses, and $100 in slippage and commissions.
See the Tradestation report below for full out of sample performance.
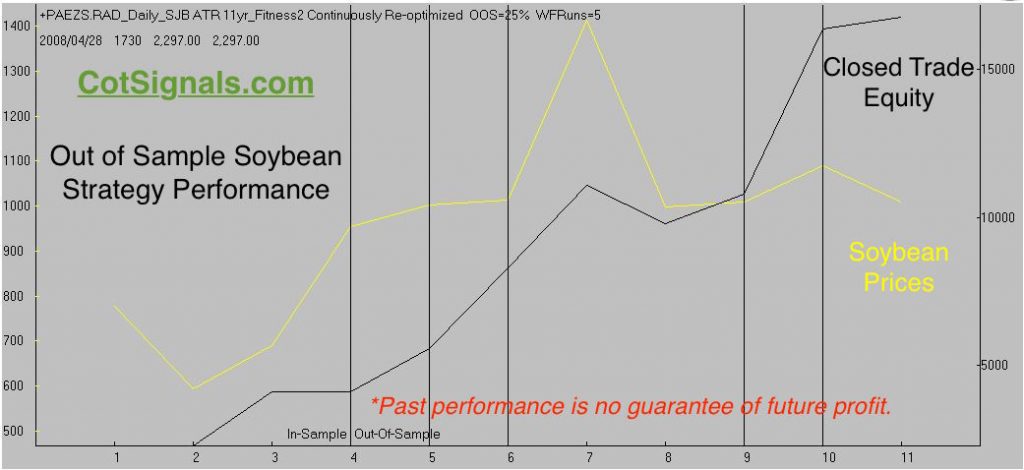
The equity curve is plotted, below. Two things to notice. First, it wasn't able to avoid taking a loss during soybeans' decline in 2015. Secondly, the optimization windows are farther apart than we just saw with the British Pound. Usually, this means the soybean trade has been more consistent, historically. Therefore, the model is slower to adjust than the British pound model, which recalculated approximately one-third more frequently. Ultimately, model selection comes from finding the best performance balance within a repeatable range.
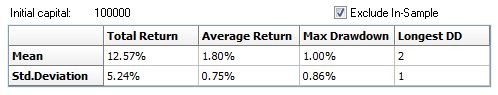
Finally, we'll close with the Monte Carlo statistics. The results below are the composite results of 1,000 walk-forward runs based on a $100k account size. This provides a more representative sample of trade expectations. Once again, the drawdown/return metrics coupled with the expected winning percentage meets the edge necessary to put my dollars at risk. Remember, I developed this to trade my account, as well.
Final Notes:
The soybean market was able to reverse higher on the Prospective Plantings report. This triggered a pattern-based rally and breakout higher of a bull flag formation. Ideally, we'll get a brief pullback off the reactionary move higher before resuming the 2018 rally. Extrapolating the strategies' move into the future, we expect May soybeans to eclipse the early March high at $10.825. However, we do not expect the rally to continue overall or, for soybean prices to have a strong year barring weather concerns.
As always, we'll send out the entry signal once it's generated and follow up nightly with the dynamic stop's calculation.


