

I had planned an in-depth look at platinum and gold both individually and, spread against one another. There are predictable setups in all three of these tradeable vehicles. However, my body just hasn't been willing to let me spend much time at my desk, and the platinum trade is rapidly approaching. Therefore, today's analysis will focus solely on the upcoming platinum trade and the relationship between the commercial traders, as categorized by the Commitment of Traders report, and commodity market seasonality.
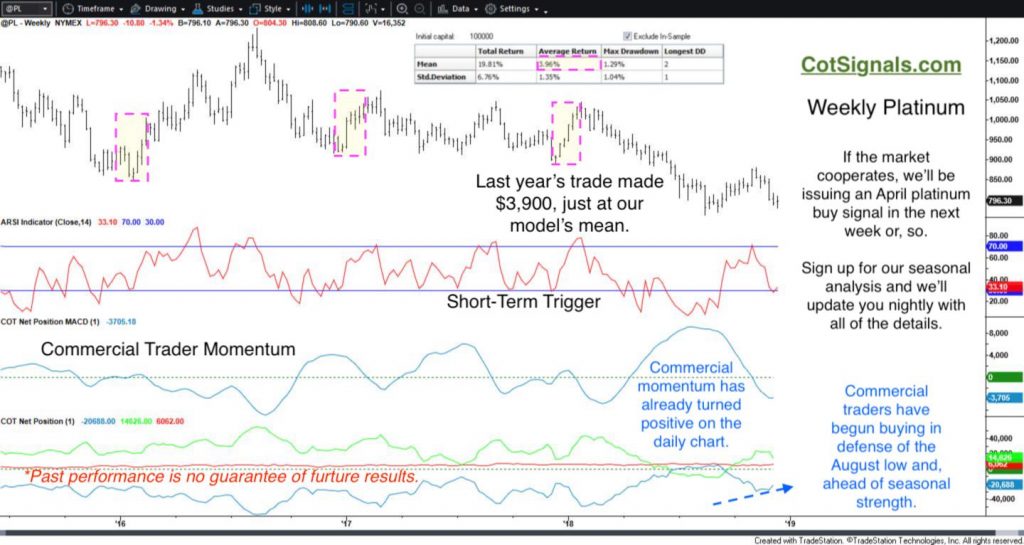
Platinum has been in a broad downtrend for several years and is threatening the August lows to extend this trend. However, this was precisely the case two years ago when platinum rallied $100 off its low near the end of 2016. Platinum has bounced strongly in each of the last several years. The magnitude of that bounce, as measured by our model has been near $4k per contract. While we never know what the market may give us from year to year, we can be confident that our risk will not exceed 4.5% of our entry price.
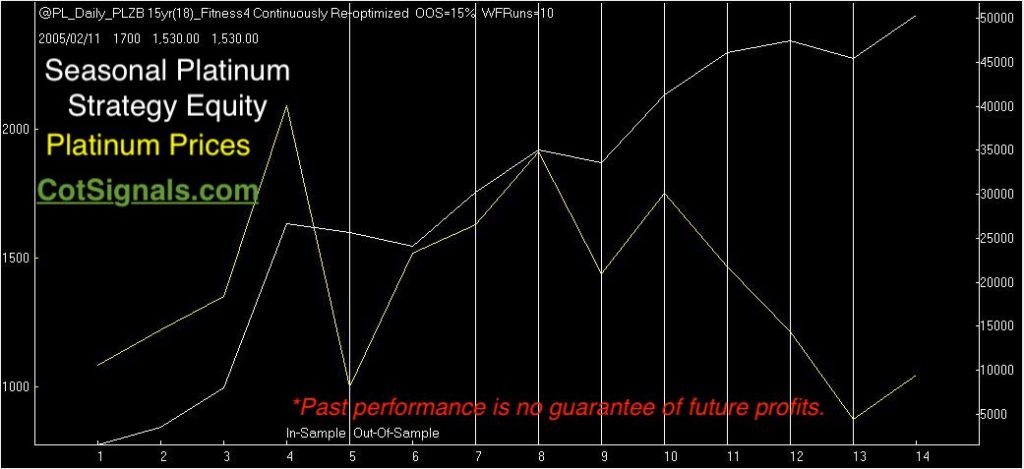
The next chart is the model's out of sample equity curve in white with platinum prices in yellow. Notice that this long only strategy has managed to consistently catch profitable moves higher even in a downward trending market.
*Past performance is no guarantee of future profitability.
*Past performance is no guarantee of future profits.
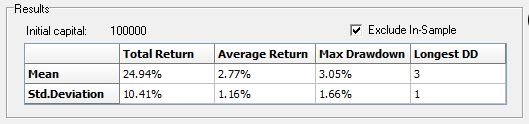
The updated Monte Carlo results for this year reveal smaller expectations in our returns as well as the standard deviation of the returns. This reflects the continued decline of platinum and the corresponding decline in volatility. From a trading standpoint, I look for an opportunity with a solid winning percentage and an average return equal to twice the standard deviation of the returns. This trade meets these conditions. therefore, I'll be taking a long position in April platinum by Monday, at the latest. Sign up for our seasonal analysis, and I'll email you daily with the entry signal, protective stop price and tell you when to get out. After all, I'm trading this as well.
*Past performance is no guarantee of future profits.
As we've discussed position sizing strategies, the platinum should be a clear one lot for those who've been following the model account. Remember, if platinum is trading at $800 per oz, and we're risking 4.5% from the entry point, that's $36 per contract which equals $1,800.
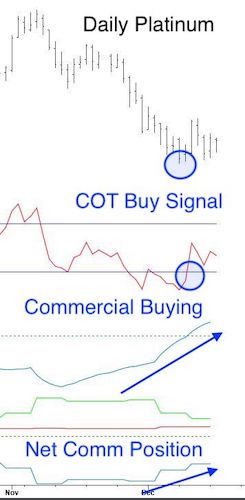
Finally, let's examine the way the COT Signals catch the same type of swing trading action. Even though the Discretionary COT Signals are blind to seasonality, it's incredible how often commercial trader activity triggers the same kind of trade within the expectations of a given window of time.
We're not sure if the August low will hold. I kind of doubt it. I do think a new low may be just the short trap necessary to kickstart platinum's expected seasonal move higher.
Best, Andy Waldock.
*There is a significant risk of loss in futures trading and only true risk capital should be used.


