

Seasonality always varies to some degree from year to year. For most markets, varying seasonality is still tied to the cyclicality of their particular feature; like spring planting, fall harvests, summer vacations, and taxes. The natural gas market, on the other hand, has shifted the volatility of its seasonal behavior from the hurricane months of late summer to the Polar Vortices of Late January through February.
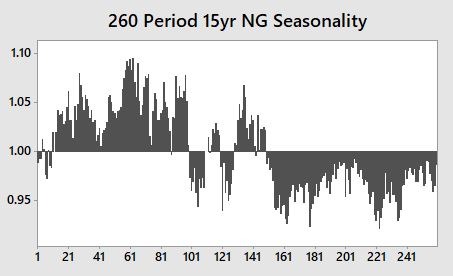
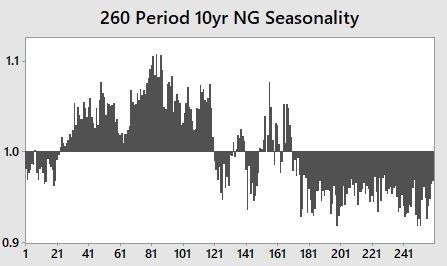
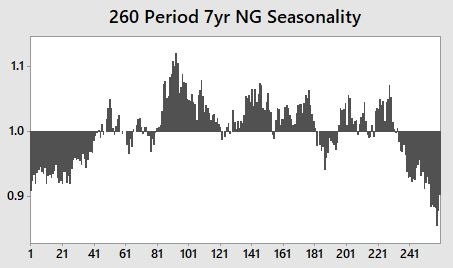
Below, are three deconstructed, ratio adjusted data streams of 15, 10, and seven years. Historically, natural gas has been cheap through the fall and expensive through the spring. Natural gas used to be used for heat more than air conditioning. Therefore, there was little demand from late summer through fall. Of course, the great contradiction of the natural gas market in late summer and early fall is that declining demand coincided with hurricane season. The combination of declining demand led to low volume, which led to wild price spikes any time Mother Nature threatened the Gulf coast.
The shifting seasonality makes it tough to pin down highly accurate trading opportunities. This is further complicated by the fact that CFTC hasn't published a Commitments of Traders report in three weeks. This means we don't know which side the big traders are playing or, how deeply they're invested at the current price.
But, we do know what they've done, historically. And we'll be able to see that, despite the lack of current data, we will be able to see that the commercial traders remain hard sellers through early February.
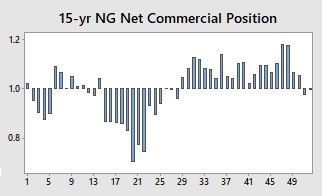
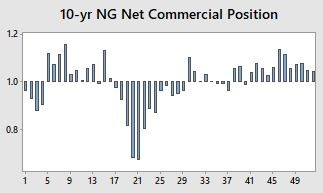
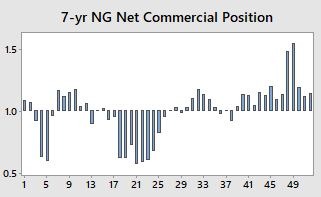
Notice how the selling has intensified through the 4th and 5th weeks of the year?
Now, based on the predicted weather pattern throughout most of the northern US for the next week, we're going to hold off on short selling natural gas futures for at least a couple of days. Ideally, the expected record cold will drive prices up in the short-term and allow us to enter a new, short position at a more favorable price.
We expect this to be our last seasonal trade for January. Market conditions have pushed several of our trades into February. Seasonal trading strategies shouldn't be taken blindly based on a buy on this date, sell on that date format. We take recent market action into account in the publication of the seasonal commodity strategies I employ. This makes it harder to plan but, typically, increases the accuracy and more importantly, reduces risk.
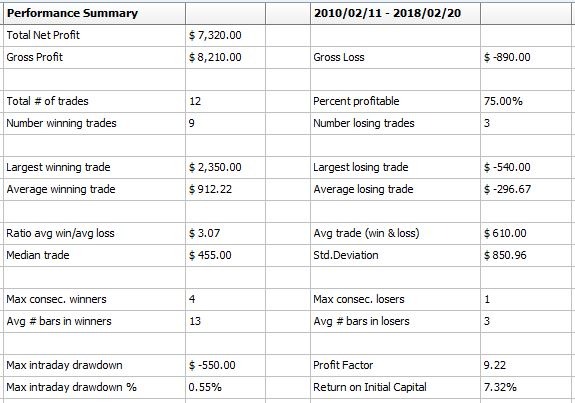
Here are the out of sample results over the last ten years for the model we intend to employ.
*Commodity trading is inherently risky and should only be undertaken with true risk capital.
Stay tuned or, subscribe for a natural gas seasonal trading strategy, including entry, exit, and protective stop, to employ in the face of record cold weather conditions. If history has anything to teach us about natural gas volatility it's that it is very much a, "buy the rumor, sell the fact" type of market.


